Get Started
Get Started
Data for Humans
Why Dashboards No Longer Cut It: A Paradigm Shift in Data Communication
Why Dashboards No Longer Cut It: A Paradigm Shift in Data Communication
We’ve spent years building data solutions around developer constraints rather than real-world usage—and it’s stifling innovation. Learn how shifting to a narrative-driven, human-focused approach unleashes the true power of data, bridging technical silos and unlocking game-changing insights.
We’ve spent years building data solutions around developer constraints rather than real-world usage—and it’s stifling innovation. Learn how shifting to a narrative-driven, human-focused approach unleashes the true power of data, bridging technical silos and unlocking game-changing insights.

Over the last decade, organizations have invested heavily in data engineering solutions—data lakes, pipelines, and endless dashboards—to unlock insights and drive better decisions. But ironically, these supposed “solutions” often leave the real decision-makers stranded. It’s not that the data isn’t there or that we lack sophisticated technology; it’s that the entire ecosystem is built by engineers, for engineers, paying little mind to how actual humans gather context, collaborate, and iterate on ideas. Dashboards remain static and locked into predefined metrics—rarely adapting to the shifting questions leaders and frontline teams face every day.
In this article, we’ll examine how an overemphasis on purely technical architecture leads to decentralized reporting chaos, and why modern concepts like data meshes and lakehouses only solve part of the puzzle. We’ll then explore how a narrative-first approach—amplified by tokenization and generative AI—can foster truly dynamic data experiences. By refocusing on human-centric design, analysts are free to tackle meaningful modeling and infrastructure work, while leadership and domain experts gain agile, context-rich insights that speak their language and evolve alongside real-world needs.
The Dashboard Dilemma
The Dashboard Dilemma
For years, dashboards have been touted as the “silver bullet” for business intelligence. They provide interactive charts, filters, and a real-time view of KPIs—promising that leadership can “slice and dice” data whenever they want. But here’s the catch: dashboards alone rarely adapt to the changing questions that executives or department heads have.
A Never-Ending Cycle of Screenshots
A Never-Ending Cycle of Screenshots
When a key meeting is scheduled, someone inevitably takes a snapshot of the dashboard, drops it into PowerPoint, and adds a few bullet points. Suddenly, any interactive benefit is lost, the context is partial, and further analysis requires flipping back to the original tool—assuming everyone has access and knows how to navigate it.
When a key meeting is scheduled, someone inevitably takes a snapshot of the dashboard, drops it into PowerPoint, and adds a few bullet points. Suddenly, any interactive benefit is lost, the context is partial, and further analysis requires flipping back to the original tool—assuming everyone has access and knows how to navigate it.
The Underlying Problem
The Underlying Problem
1—Static Mindsets: Even with filters, dashboards lock data into pre-built visuals. They rarely encourage dynamic storytelling or the addition of new insights on the fly.
2— Limited Context: Metrics appear without deeper narrative scaffolding—leading to confusion when new questions arise.
3— Fractured Collaboration: Different teams maintain their own dashboards, resulting in siloed truths and misaligned KPIs.
The result: business users still rely on offline presentations and chat tools to communicate crucial insights, undercutting the promise of real-time “self-service” analytics.
The Root Causes:
Decentralized Efforts & Siloed Expertise
The Root Causes:
Decentralized Efforts & Siloed Expertise

The Underlying Problem
In many companies, different departments collect data in wildly different ways, with little to no overarching strategy. Marketing might harvest leads from a CRM, while finance holds transactional data in a legacy database. Meanwhile, operations relies on IoT sensors. This decentralized approach leads to:
In many companies, different departments collect data in wildly different ways, with little to no overarching strategy. Marketing might harvest leads from a CRM, while finance holds transactional data in a legacy database. Meanwhile, operations relies on IoT sensors. This decentralized approach leads to:
Inconsistent Standards: Varying naming conventions, data types, and refresh cycles.
Disparate Systems: On-premises servers for one team, cloud for another, and spreadsheets for yet another.
No Single Source of Truth: Leadership gets conflicting reports, each claiming to be “the latest data.”
Inconsistent Standards: Varying naming conventions, data types, and refresh cycles.
Disparate Systems: On-premises servers for one team, cloud for another, and spreadsheets for yet another.
No Single Source of Truth: Leadership gets conflicting reports, each claiming to be “the latest data.”
Engineering Overload Meets Business Frustration
Engineering Overload Meets Business Frustration
When a key meeting is scheduled, someone inevitably takes a snapshot of the dashboard, drops it into PowerPoint, and adds a few bullet points. Suddenly, any interactive benefit is lost, the context is partial, and further analysis requires flipping back to the original tool—assuming everyone has access and knows how to navigate it.
When a key meeting is scheduled, someone inevitably takes a snapshot of the dashboard, drops it into PowerPoint, and adds a few bullet points. Suddenly, any interactive benefit is lost, the context is partial, and further analysis requires flipping back to the original tool—assuming everyone has access and knows how to navigate it.
Data engineers strive to unify these sources, building elaborate pipelines, schemas, and transformations. Tools like data mesh and lakehouses aim to distribute data ownership yet keep a semblance of governance. But technology can only solve half the problem if the people relying on that data don’t speak the same language—or if they can’t easily reshape the data story as their questions evolve.
Meanwhile, business teams become frustrated. They often don’t know where to look for reliable answers, and they’re forced to navigate overly technical environments. The inevitable conclusion: “Just send me an Excel, or a PDF, or maybe a PowerPoint.” The communication gap widens.
Real-World Scale: In one example, an organization unified over 70B rows of data across diverse sources—aviation, taxi, buses, safety, and traffic—yet non-technical teams still struggled to ask the right questions or spot hidden correlations because dashboards alone fell short of providing actionable narrative views.
When Leadership Is Overwhelmed
When Leadership Is Overwhelmed
Executives and senior managers often receive:
1— Multiple Dashboards: Each from different teams, using inconsistent metrics.
Email Attachments: Scrambled spreadsheets that are quickly outdated.
2—Chat Requests: Informal messages asking for “quick fixes” to data points.
3—Ad Hoc PowerPoints: Thrown together at the last minute to prepare for critical meetings.
Instead of cohesive insights, they’re bombarded with disconnected visuals that fail to form a single, coherent narrative. The big-picture context is lost in a flood of micro-level details. Ultimately, leadership falls back on gut instinct, or they task analysts with merging these scattered bits of information—reinventing the wheel every time.
Why Data Meshes & Lakehouses Aren’t the Complete Answer
Why Data Meshes & Lakehouses Aren’t the Complete Answer
To be clear, modern data architectures like data mesh and lakehouses solve important engineering challenges:
1— Data Mesh: Advocates for domain-based ownership, allowing teams to manage their own data as “products.”
2— Lakehouse: Combines the scalability of data lakes with the structured approach of data warehouses.
They address storage, scalability, and access in groundbreaking ways. But they still don’t tackle the communication void that exists between data teams and the wider organization.
If a marketing lead wants to quickly pull a metric and embed it in a narrative about shifting consumer behavior, they typically lack the tools or frameworks to do this seamlessly. Lakehouses give them better data, faster—yet the final storytelling piece remains painfully manual.
Pivoting from Rigid Dashboards to Adaptive Narratives
Pivoting from Rigid Dashboards to Adaptive Narratives
What truly drives decision-making? Stories. Humans are hardwired to connect with narratives, not static charts. While dashboards can display metrics, they rarely pivot to address new angles or shifting priorities. By moving from preset visuals to adaptive narratives, organizations empower leaders to ask fresh questions and get contextually rich answers in real time.
What truly drives decision-making? Stories. Humans are hardwired to connect with narratives, not static charts. While dashboards can display metrics, they rarely pivot to address new angles or shifting priorities. By moving from preset visuals to adaptive narratives, organizations empower leaders to ask fresh questions and get contextually rich answers in real time.
Why Narratives Matter?
Dynamic Context
Narratives can instantly integrate new data points, reflecting evolving questions or market changes without forcing users to build entirely new dashboards.
Shared Understanding
A story-based approach ensures multiple departments converge on the same interpretation of the data, minimizing the risk of siloed truths.
Immediate Action
Instead of ending with a chart, narratives offer clear calls to action—mapping insights to next steps that drive tangible results.
The Power of Tokenization for Governance & AI
The Power of Tokenization for Governance & AI
A crucial ingredient in unlocking real-time, adaptive narratives is tokenization. Instead of tying data to a rigid visual element (like “column X goes to bar chart Y”), we encapsulate data in tokens—self-contained entities that carry:
A crucial ingredient in unlocking real-time, adaptive narratives is tokenization. Instead of tying data to a rigid visual element (like “column X goes to bar chart Y”), we encapsulate data in tokens—self-contained entities that carry:
Source Info: Which dataset the token originates from, how fresh it is, and any transformations applied.
Usage Metadata: Where else this token is used (other reports, narratives, or channels), who has accessed it, and under what conditions.
Governance Rules: Permissions, data lineage, and compliance tags, ensuring only authorized viewers can see or manipulate sensitive information.
Contextual Hooks: Additional textual or visual context that generative AI can leverage to produce coherent narratives, explanations, or summaries on the fly.

Why It Matters
Why It Matters
Traceable Insights: Leadership can see exactly how a number was derived, maintaining trust in the data.
Cross-Domain Reusability: A token created by the finance team can be reused in a marketing narrative, retaining consistent definitions and lineage.
Generative AI Integration: Tokens provide the building blocks for AI to generate fully contextualized narratives. Rather than spit out random text, the AI understands the token’s domain, constraints, and usage patterns—creating a cohesive story in seconds.
Human-Centric Solutions in Action
Human-Centric Solutions in Action
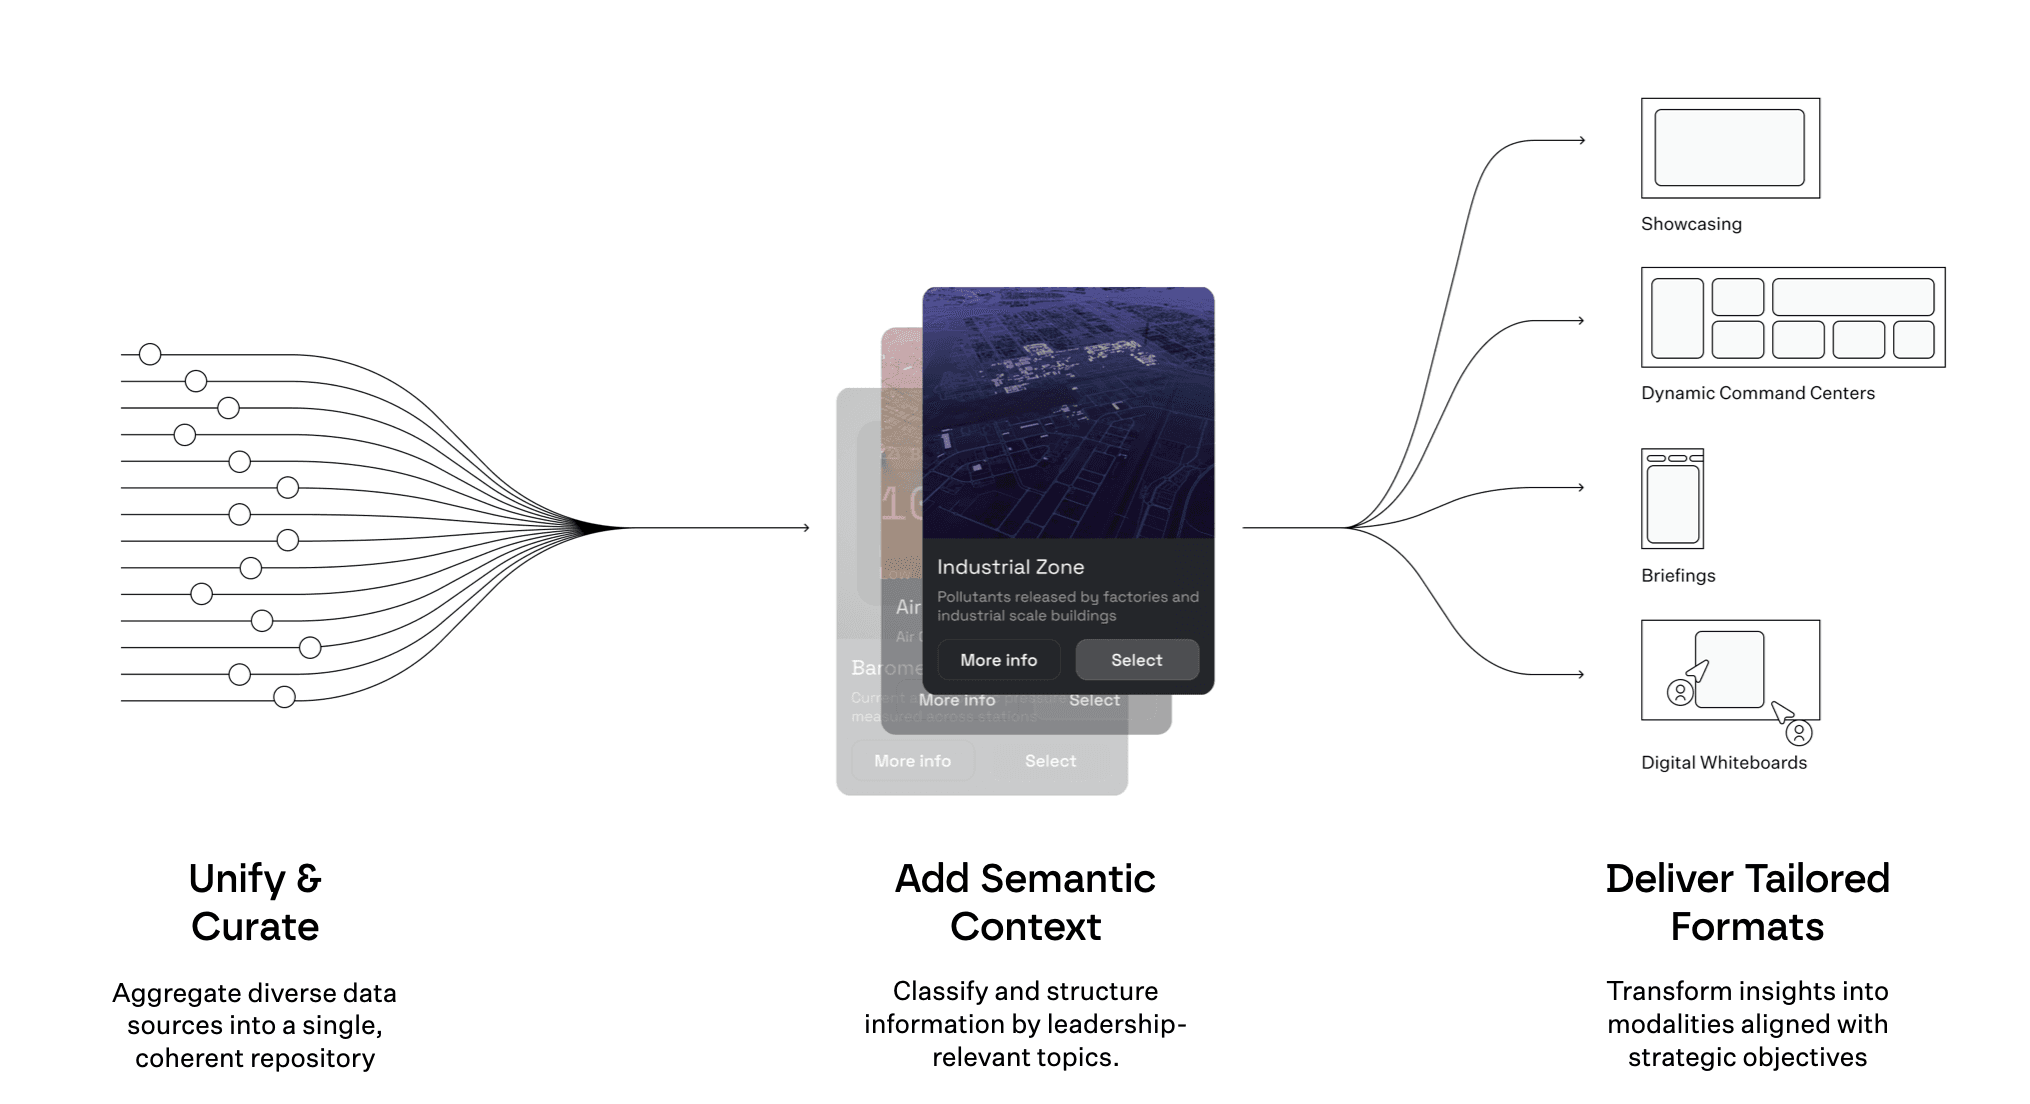
Embracing a human-centric approach starts with recognizing that data must serve real-world needs: leadership alignment, daily operations, strategic pivots, and cross-department collaboration. By combining workshops, holistic frameworks, and flexible modalities, organizations can tackle long-standing data frustrations while preparing for future growth.
Embracing a human-centric approach starts with recognizing that data must serve real-world needs: leadership alignment, daily operations, strategic pivots, and cross-department collaboration. By combining workshops, holistic frameworks, and flexible modalities, organizations can tackle long-standing data frustrations while preparing for future growth.
Workshops & User Engagement
Before writing a line of code, we run discovery sessions with stakeholders to understand pain points, goals, and decision flows.
Holistic Tools & Frameworks
Internal platforms focus on narrative-building, enabling domain experts to fuse data into stories without constant developer intervention.
Modular Modalities
Whether it’s a mobile briefing, interactive whiteboard, or command-center setup, the emphasis stays on clarity and actionability
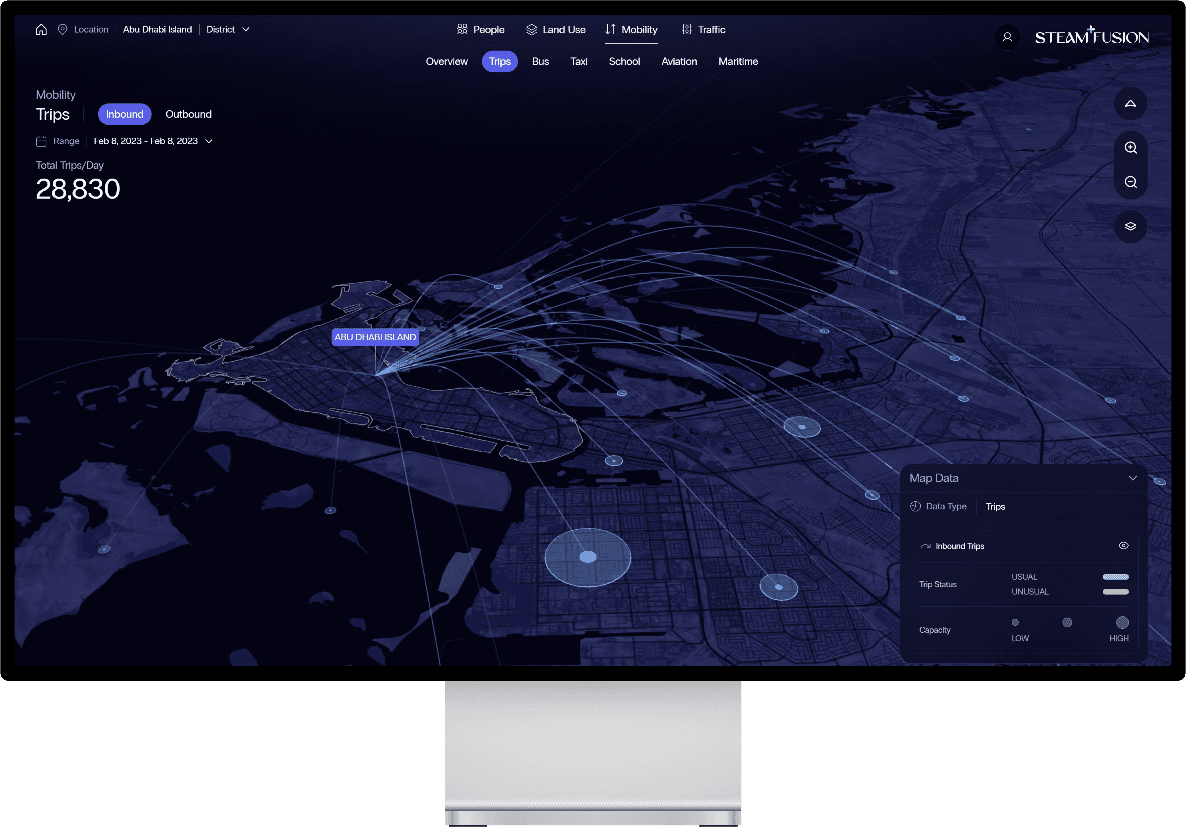
(Real-world example: A city-scale mobility project where planners, operations, and government officials collaborated live on a shared data narrative—rather than siloed dashboards—leading to faster decisions on transport initiatives.)
(Real-world example: A city-scale mobility project where planners, operations, and government officials collaborated live on a shared data narrative—rather than siloed dashboards—leading to faster decisions on transport initiatives.)
Time Saved: In another deployment, a data scientist who once spent three weeks compiling end-of-month reports saw that time drop to mere minutes. Freed from repetitive tasks, the analyst focused on advanced modeling—saving thousands of hours annually.
Time Saved: In another deployment, a data scientist who once spent three weeks compiling end-of-month reports saw that time drop to mere minutes. Freed from repetitive tasks, the analyst focused on advanced modeling—saving thousands of hours annually.
Expanding the Narrative with Multi-Modal Token Browsers & Command Centers
Expanding the Narrative with Multi-Modal Token Browsers & Command Centers
Tokens go beyond static visuals. They carry context, titles, tooltips, and deeper “dives”—like a built-in script of how each data point can be explored or explained. This allows for:
Tokens go beyond static visuals. They carry context, titles, tooltips, and deeper “dives”—like a built-in script of how each data point can be explored or explained. This allows for:
Drag-and-Drop Collaboration
Through a token browser, users navigate by topics (e.g., “revenue trends,” “incident reports,” “customer sentiment”) rather than by abstract columns or tables. They can drag tokens onto a digital whiteboard—instantly displaying relevant visuals and context for on-the-spot exploration.
Command-Center Monitoring
In tactical or critical scenarios, tokens can trigger rapid layout changes on large screens—displaying real-time camera feeds, countdown timers, and KPIs tied to an emergency or incident. This immediate, threshold-based adaptation ensures command centers only see what matters most, exactly when they need it.
Automatic Dashboard Generation
When an incident is flagged, tokens can auto-assemble a “dashboard on the fly.” It might pull in location-based cameras, related KPIs, and a timer for critical updates—no manual fiddling required.
Real-Time Collaboration
A marketing analyst and a finance manager can co-edit a single data story, bringing in tokens that reflect their different domains. This synergy reduces the bottleneck on data teams and fosters meaningful cross-department insights.
By tokenizing data elements and embedding them into flexible, multi-modal experiences—like whiteboards for brainstorming or command centers for rapid response—organizations can break free from the static dashboard paradigm. Leadership, domain experts, and data teams all gain a shared, living workspace that evolves with shifting needs.
Empowering Data Teams & Fostering Top-Down + Bottom-Up Synergy
Empowering Data Teams & Fostering Top-Down + Bottom-Up Synergy
Far from just a fancy feature, token-based collaboration frees data professionals to focus on what truly matters—robust infrastructures, optimized models, and forward-thinking data strategies—instead of churning out endless, static dashboards. Meanwhile, domain experts with minimal technical backgrounds can easily create or adjust narratives without having to wait in a queue for support.
Far from just a fancy feature, token-based collaboration frees data professionals to focus on what truly matters—robust infrastructures, optimized models, and forward-thinking data strategies—instead of churning out endless, static dashboards. Meanwhile, domain experts with minimal technical backgrounds can easily create or adjust narratives without having to wait in a queue for support.
Top-Down Clarity
Executives and managers set strategic priorities, guiding which tokens (topics) matter most. They request new angles or narratives in real time, ensuring that organizational goals stay front and center.
Bottom-Up Innovation
Department-level users—like a marketing specialist or supply chain analyst—bring domain insights to the table. They can propose new explorations, drag relevant tokens into a workspace, and highlight emerging trends before they escalate.
Reduced Bottlenecks
Since each team member can interact directly with tokens, data teams aren’t bogged down generating one-off dashboards. Instead, they ensure the pipeline, governance, and overarching architecture remain solid and scalable.
Holistic Decision-Making
By blending top-down strategy with bottom-up expertise, leadership gains a more holistic view—one that reflects both broad objectives and on-the-ground realities.
This two-way flow of information weaves the entire organization into a cohesive data narrative, eliminating the typical back-and-forth of screenshot-driven presentations and last-minute deck overhauls.
Breaking the Cycle: From Visual Overload to Meaningful Stories
Breaking the Cycle: From Visual Overload to Meaningful Stories
Visualizations are powerful, but relying on them as the end point can lead to “visual overload” instead of clarity. Leaders find themselves conforming their questions to what each dashboard can display. In a narrative-driven model, the data story adapts to the questions—letting charts and graphs serve as supporting characters rather than the entire show.
Visualizations are powerful, but relying on them as the end point can lead to “visual overload” instead of clarity. Leaders find themselves conforming their questions to what each dashboard can display. In a narrative-driven model, the data story adapts to the questions—letting charts and graphs serve as supporting characters rather than the entire show.
Key Shifts
Key Shifts
From Data to Dialogue
Users no longer just absorb metrics; they engage in a two-way exploration that encourages deeper insight and real-time discovery.
From Stale Reports to Living Conversations
No more static PowerPoint decks or PDF exports. A narrative environment invites continuous iteration, enabling teams to enrich the story over time.
From Siloed Views to Unified Perspectives
Tying every insight back to a cohesive narrative bridges the gap between technical teams and business stakeholders, facilitating strategic alignment.
By reframing charts and dashboards as elements of a larger, evolving narrative, organizations liberate leadership from data monotony—ultimately driving decisions that resonate across every level and function.
Human-Centric Design Meets Leader-Driven Data Ecosystems
Human-Centric Design Meets Leader-Driven Data Ecosystems
We’ve highlighted the shortcomings of traditional dashboards and purely technical architectures. Now, here’s how we approach building future-proof decision support systems:
Begin with Leadership Vision
Every successful data strategy starts at the top. We align with executives to clarify high-stakes decisions and ensure each solution directly supports the organization’s mission-critical outcomes.
Design for Collaborative Engagement
Departmental gaps hinder progress. Our frameworks unify domain experts, data teams, and operational staff in a shared environment—replacing siloed metrics with co-created narratives that evolve with every new insight.
Fuel a Culture of Data Communication
Insights only matter when they lead to well-informed decisions. Beyond setting up pipelines or dashboards, we promote a “narratives first” culture—replacing stagnant reports with cohesive, interactive stories everyone can understand and engage with.
Enable Living Data Narratives
Static charts don’t hold people’s attention for long. By centering on dynamic, topic-based exploration, we empower all stakeholders to shape, refine, and share stories that connect the dots and drive timely action.
Establish a Future-Proof Foundation
Our modular architecture integrates smoothly with new data sources or advanced analytics—so you can scale securely without overhauling your entire infrastructure. This keeps you agile as organizational demands shift.
Conclusion: Communication Is the Real Differentiator
Conclusion: Communication Is the Real Differentiator
We’re at a pivotal juncture in data’s evolution. Though the complexity and volume of information continue to grow, the methods we use to present that data remain largely stuck in engineering paradigms or legacy dashboards. Sure, data mesh and lakehouses address key storage and architectural issues—important ones, at that. But if we don’t solve the communication problem, if we don’t align the data story with leadership’s needs, we’ll keep seeing the same cycle of confusion and ad hoc solutions.
We’re at a pivotal juncture in data’s evolution. Though the complexity and volume of information continue to grow, the methods we use to present that data remain largely stuck in engineering paradigms or legacy dashboards. Sure, data mesh and lakehouses address key storage and architectural issues—important ones, at that. But if we don’t solve the communication problem, if we don’t align the data story with leadership’s needs, we’ll keep seeing the same cycle of confusion and ad hoc solutions.
A Call to Action
A Call to Action
Embrace Narrative Design
Move beyond static visuals to narratives that adapt in real time, guided by user queries and domain contexts.
Invest in Human Skills
Don’t treat data as an engineering-only domain. Integrate communication specialists, UX designers, and domain experts.
Rethink “Reporting”
Challenge the assumption that a single dashboard or monthly deck is enough. Create living, collaborative data stories that evolve with business priorities.
Champion a Mindset Shift
Data-driven leadership isn’t about bigger databases or more complex algorithms—it’s about forging a clear, unified understanding that leads to informed action.
Data doesn’t have to be overwhelming or fragmented—not when we put communication at the forefront. By combining domain expertise, human-centric design, and a narrative-driven approach, organizations can finally harness the true power of data: driving the conversations and decisions that make a lasting impact.
